Energy Modeling for Efficient Dallas Building Design
Energy Modeling for Efficient Dallas Building Design
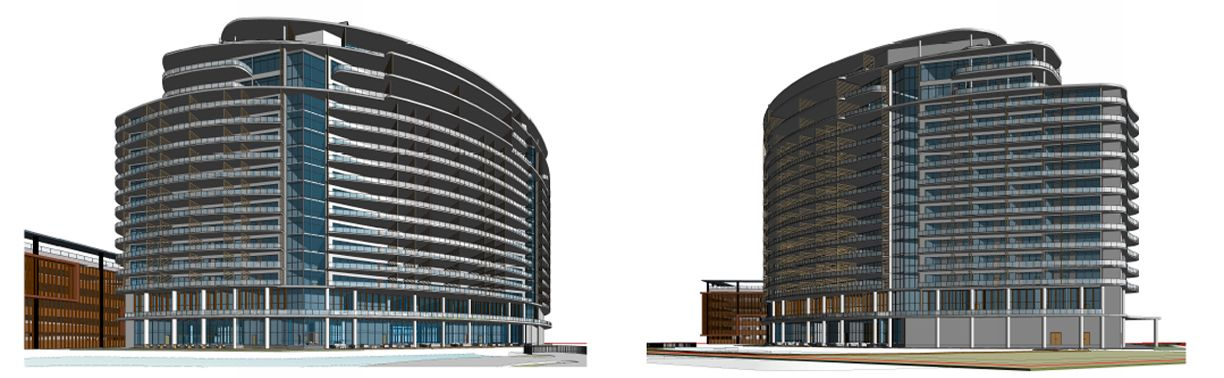
The Dallas–Fort Worth (DFW) metroplex is in a construction sprint—Class A towers in Uptown, health campuses in Plano, adaptive reuse in Fort Worth, mixed‑use in Frisco and Las Colinas. Owners want striking architecture, but they also want predictable operating costs, comfort that keeps tenants happy, and credible ESG performance. In North Texas, where the cooling season drags on, humidity bites, and ERCOT peaks can punish the unprepared, energy modeling is the practical lever that aligns design ambition with financial reality.
At Archline, LLC, our models aren’t academic exercises. We translate simulation into design choices you can stamp into drawings and verify after occupancy. We help A/E teams right‑size equipment, tune envelopes for Dallas sun, script controls that hold up in July, and document savings that support LEED, local code, incentives, and investment committees. The outcome: buildings that perform in the wild, not just in the render.
Why energy modeling matters specifically in Dallas
- Cooling‑dominant climate: Dallas spends much of the year in cooling mode. Oversized chillers and mis‑tuned reheat loops quietly burn money. Modeling clarifies true peak loads and seasonal behavior.
- Local code + green program alignment: IECC/ASHRAE baselines with Dallas amendments, plus the Dallas Green Building Program, push projects toward efficient envelopes, lighting, and controls. Simulation turns “should comply” into “will comply.”
- ERCOT volatility and demand charges: Peak events can blow up a budget. Scenario‑testing demand response, thermal storage, and load shedding is the difference between theory and avoided costs.
- ESG and leasing pressure: Tenants and investors are asking for projected EUI, carbon, and IAQ performance. Modeled evidence opens doors.
- First‑cost control: Early runs often reveal envelope or glazing tweaks that shave tons off plant sizing and electrical infrastructure.
How energy modeling works (and what we include)
We build a digital performance twin of your proposed design using platforms like EnergyPlus/OpenStudio or IESVE. The model includes:
- Envelope: U‑values, SHGC, thermal bridges, infiltration.
- Internal gains: Schedules for people, lighting, equipment; diversified by program type.
- HVAC: System archetypes (VAV w/ reheat, DOAS+VRF, WSHP, water‑cooled chillers), efficiencies, fan laws, heat recovery, control sequences.
- Lighting + daylighting: LPD targets, daylight dimming curves, sensor zoning, glare controls.
- Water–energy nexus: DHW loads, cooling tower cycles, pumping, irrigation.
- Renewables & storage: PV orientations, inverters, battery dispatch strategies.
We produce a code baseline model and a proposed design model, then iterate scenario runs to test decisions before they’re expensive to change.
Twelve Dallas‑focused strategies we prove (or disprove) with modeling
1) Right‑sizing for cooling peaks
Dallas peaks are dominated by solar gain and latent load. We simulate design‑day conditions with realistic diversity, then compare chiller/VRF sizing options. Often, strategic shading + better glazing chops 10–20% off plant tonnage and electrical service.
2) SHGC, orientation, and facade rhythm
We study window‑to‑wall ratio (WWR) by facade, SHGC by orientation, and overhang depths. You keep views where they sell; we claw back cooling load where it hurts. The model shows EUI and comfort impacts of each facade choice before CDs lock.
3) Infiltration and thermal bridges
Dallas winds + temperature swings make infiltration costly. We quantify savings from air‑barrier detailing and identify thermal bridges (slab edges, shelf angles). A few detail changes can outperform gadget‑heavy add‑ons.
4) DOAS + heat recovery vs. VAV reheat
We pit common archetypes against each other for your program. DOAS+VRF shines in offices and schools; high‑efficiency VAV with heat recovery can dominate in tall cores. Modeling neutralizes vendor bias with lifecycle math.
5) Demand‑controlled ventilation (DCV) that actually pays
CO₂/occupancy‑based DCV reduces latent load in shoulder and evening hours. We test sensor density and control bands so you save energy without IAQ complaints.
6) Supply air temperature and static reset
Sequence simulations show how far you can push SAT and static pressure resets before zones complain. Right resets = fewer reheat hours, happier tenants, quieter fans.
7) Daylight harvesting that doesn’t create glare
We pair daylight and energy models to zone sensors, set dimming curves, and check glare probability. The goal: lower LPD and better comfort—especially in classrooms and open offices.
8) Cooling tower + pump optimization
We test condenser water setpoints, variable primary pumping, and VFD strategies. A few degrees of condenser relief in Dallas summer can shift chiller efficiency notably.
9) PV + battery dispatch for ERCOT peaks
We simulate PV output vs. load shape and layer in battery controls to trim peak kW. On large roofs/garages, the combined strategy can slash demand charges and support resiliency narratives.
10) Reheat minimization
We identify zones that persistently fight reheat. Design fixes (decoupled ventilation, terminal type changes, better zoning) emerge from data, not guesswork.
11) Domestic hot water (DHW) and heat pump viability
Heat pump water heaters can pay in multifamily and hospitality; we model COP vs. ambient and tie it to building heat rejection for synergistic gains.
12) Post‑occupancy tuning plan
We script trend logs and KPIs in design so FMs can verify performance. The model defines targets; analytics keep you near them.
Our Dallas energy modeling workflow (the deliverables you actually need)
- Kickoff + KPI charter (week 0–1): Agree on targets: EUI, peak kW, comfort bands, code/LEED goals, rebate eligibility.
- Baseline + proposed v1 (week 1–3): Build code and concept models; publish first deltas and “low‑regret” moves.
- Scenario sprints (week 3–6): Facade, systems, and controls packages tested in 2–3 rapid cycles with side‑by‑side results.
- Lifecycle economics (week 5–7): First cost, utility cost, maintenance, and simple payback/NPV summarized for decision meetings.
- Controls narrative + sequences (DD): Translate modeled sequences (DCV, resets, economizer) into spec language the BAS can execute.
- Incentive/LEED documentation (CD): Provide forms, energy narratives, and M&V points for rebates and EA credits.
- CA support + acceptance (late CD/CA): Review equipment submittals for modeled efficiencies; verify sensor zoning and BAS points lists.
- Post‑occupancy tune (Y1): Compare meter data vs. model, adjust setpoints, and lock seasonal schedules.
Ten local case snapshots (DFW)
Uptown Dallas Office Tower (core & shell): Facade shading + lower SHGC cut peak tons 18%; downsized chillers saved ~$450k capex and reduced annual energy 12%.
Frisco Municipal Services Center: PV canopies + DCV modeled; achieved ~28% energy savings and qualified for Oncor rebates; LEED Gold.
Plano Tech Campus (multi‑building): DOAS+VRF with aggressive SAT/static reset; ~$220k first‑year utility savings; tenant submetering improved billing accuracy.
Fort Worth Arts Renovation (historic): Daylight harvesting + interior insulation dew‑point analysis; 17–19% utility reduction without harming fabric.
Las Colinas Mixed‑Use: CHP sizing via load diversity modeling; ~15% energy cost cut and improved resilience for hotel loads.
Dallas Medical Pavilion: ERV payback modeled at <4 years for clinics/surgery; 20% ventilation energy reduction; improved humidity control.
Richardson STEM School: South‑light clerestories modeled; glare index contained; 18% EUI reduction and better test‑time comfort.
DFW Airport Concourse Retrofit: Variable occupancy modeling; 12% HVAC energy reduction without compromising hold‑room comfort.
Addison Performing Arts Center: Hybrid air systems optimized for show‑time peaks; 9% annual savings and quieter operation.
Arlington Lab Fit‑Out: High process loads balanced by heat recovery; ~14% total energy reduction vs. conventional VAV.
Dollars, incentives, and risk: what owners ask first
- Typical modeling fee vs. value: Modeling often costs ~0.2–0.5% of project construction value but regularly unlocks six‑figure capex savings (downsized plant/power) and five‑figure annual utility reductions.
- Payback: With envelope/controls/PV optimization and available rebates, Dallas projects commonly see
3–6 year simple payback on efficiency increments.
- Incentives: Programs like
Oncor can offset lighting, HVAC, and controls upgrades. Federal
§179D tax deductions reward qualified efficiency. We package the evidence so money isn’t left on the table.
- Risk reduction: Tuning for ERCOT peaks reduces exposure to volatile demand charges; good IAQ sequences reduce occupant complaints and reputational risk.
Common pitfalls (and how we avoid them)
- “Rules of thumb” sizing: Leads to bloated plants and noisy, short‑cycling equipment. We size on modeled, diversified loads and validate with sensitivity checks.
- Glare‑induced load creep: Pretty glass boxes overheat. We test WWR, SHGC, and shading until daylight and cooling agree.
- Controls no one can run: A brilliant sequence that FMs can’t maintain is wasted. We write operator‑friendly sequences with clear reset bands and alarm logic.
- Late modeling: If we start at CDs, it’s too late to change the big drivers. We model at concept so the design
is the strategy.
- Ignoring plug loads: Tenant equipment can swamp savings. We run high/medium/low scenarios to protect outcomes.
- No post‑occupancy plan: Performance drifts. We specify trend logs, KPIs, and a Y1 tuning session so savings stick.
Extended Dallas Energy Modeling FAQ
Q1: Is energy modeling required for my Dallas project?
If you’re pursuing LEED, incentives, or code compliance paths beyond prescriptive checklists, yes—modeling is the most direct route. For larger commercial and public projects, it’s increasingly expected by owners and review teams. Even when not mandated, owners use it to de‑risk plant sizing, document projected EUI, and support ESG disclosures.
Q2: How long does an energy model take?
Concept models can be built in 1–2 weeks; robust DD/CD models typically take 3–5 weeks with scenario sprints running in parallel with design milestones. Fast‑track projects can still benefit—we triage the biggest drivers (facade, systems, controls) first so key decisions are informed on time.
Q3: How accurate are modeled savings?
When inputs and schedules are realistic and commissioning is done well, we often see
within 5–10% of model predictions over the first year. The biggest driver of drift isn’t the model—it’s sequences not implemented as designed or setpoints changed without re‑tuning. That’s why we include a post‑occupancy tune.
Q4: Which software is best—EnergyPlus, IESVE, or something else?
We select the tool based on scope.
EnergyPlus/OpenStudio excels at detailed HVAC and controls.
IESVE is strong for integrated daylight/thermal studies. For early massing, we’ll use rapid tools to steer concept choices, then graduate to detailed simulation for decisions that lock in costs.
Q5: Can you model PV, batteries, and demand response?
Yes. We simulate PV yield by orientation/tilt, model battery dispatch to cut peak kW, and test simple vs. advanced demand‑response strategies. For Dallas roofs and garage canopies, PV + battery can offer compelling demand‑charge reductions.
Q6: How does modeling help with LEED?
LEED EA credits hinge on proving performance vs. a baseline. Our models generate the required narratives, tables, and M&V points. We’ll also map measures to
WELL goals (comfort, light, IAQ) so sustainability and wellness push together instead of fighting.
Q7: What if tenant loads are unknown during core & shell?
We run conservative and moderate scenarios, then document commissioning and tenant guidelines. Submetering and adjustable sequences let you tune after occupancy to protect comfort and savings.
Q8: Can existing buildings use modeling without tearing everything out?
Yes—retrofit models show where low‑cost changes (controls, setpoints, lighting, minor envelope fixes) deliver big returns. For O+M pursuits, we often pair retro‑commissioning with a light‑touch model to forecast savings and qualify for rebates.
Q9: Will modeling slow my schedule?
Done properly, no. We align deliverables with SD/DD checkpoints so results inform decisions, not arrive after them. Waiting until CDs causes delays; modeling early prevents them.
Q10: What’s the typical cost impact of design changes from modeling?
The best wins are free or low‑cost: shading tweaks, WWR rebalancing, sensor zoning, sequences. Equipment right‑sizing and electrical downsizing can
reduce capex. When there’s an upcharge (e.g., higher‑performing glazing), the lifecycle math and incentives usually justify it.
Q11: How do you make sure the BAS does what the model assumed?
We write plain‑English sequences with numeric bands, build points lists, and ask for sample graphics during submittals. During commissioning, we verify trend logs and alarms so the BAS is enforcing what the model promised.
Q12: Does energy modeling help my financing or appraisal?
Yes. Demonstrating lower EUI and peak demand, plus qualifying for incentives and tax deductions, can improve underwriting assumptions and valuation. Investors increasingly ask for modeled performance to back ESG claims.
Q13: Can you coordinate with our architect’s Revit model?
We prefer to. We exchange geometry via gbXML or direct plug‑ins, maintain space/zone alignment, and feed back envelope and system parameters for coordination. This cuts errors and speeds iteration.
Q14: What about comfort—do you model that, or just energy?
Both. We check operative temperature, humidity, and glare metrics (especially in schools and offices). Saving energy while making people miserable isn’t a win; we aim for efficiency
and comfort.
Q15: After opening day, what should my team do?
Follow the tuning plan. Review trend logs monthly in year one, confirm setpoints, and adjust schedules to actual use. Revisit reset bands seasonally. If you have analytics, set alerts for abnormal runtime or overheating; fix drift before it becomes the new normal.
Why teams across DFW hire Archline for energy modeling
- Design‑integrated: We start at concept so strategy is baked in, not bolted on.
- Constructible sequences: Operators can run what we write; we avoid “PhD‑only” controls.
- BIM + docs alignment: Specs, schedules, and points lists reflect the model; reviewers see a coherent story.
- Local fluency: We design for Dallas heat, ERCOT peaks, and the Dallas Green Building Program—without gold‑plating.
If you’re planning a tower in Uptown, a campus in Plano or Frisco, a renovation in Fort Worth, or a mixed‑use in Las Colinas, get the performance right before you pour. Let’s build a model that pays for itself—at bid time and every month after.